|
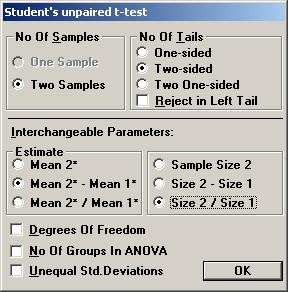
Planning a clinical trial using results from publications. A clinical trial is planned to study the effects of a new drug for treatment of patients with chronic heart failure. Of special interest in this trial is the possible change of neurohormones after 40 weeks of treatment and the plan is to make a comparison with placebo. For ethical reasons, the new drug and placebo will be added to a drug already approved and on the market for the treatment of heart failure. One of the most important neurohormone to study in this trial is aldosterone. To gain some knowledge about what effect would be clinically relevant and what variation one would expect, a literature review was started. 3. Calculation of what observed mean difference will be needed to show a significant difference in the trial. Based on the information found in the literature review and the additional calculations, it was decided that a clinically relevant difference in the mean change of aldosterone should be 50 (pg/mL). However, the true standard deviation seemed to be difficult to assess, but was assumed to be somewhere in the interval 175 to 250. The sample size needed to detect a true difference of 50 (pg/mL) with a probability (power) of 0.80 at a significance level of 0.05 could then be calculated. It turned out that the sample size needed ranged between 193 and 394 per group, depending on the value of the true standard deviation. It was finally decided to run a study with 300 patients in each group. The question was then raised what mean difference in the trial would be needed to get a significant p-value. Open the File menu and choose New Table (or New Graph for a graph). Open the Test Procedures menu and choose Student's unpaired t-test Choose the option button Two-sided and among the Interchangeable Parameters options Mean 2* - “Mean 1*and Size 2 / Size 1 and press OK.
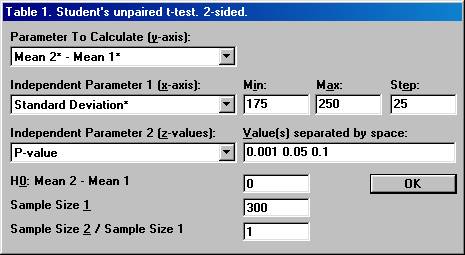
Set the parameter values as shown below and press OK
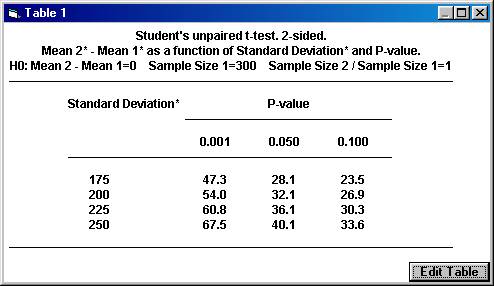
This will create a table (graph) where the mean difference needed in the trial, Mean 2* - Mean 1*, is calculated for a range of values for the calculated standard deviation and for three distinct significance levels.
|